

India adds more built-up floor space in a single year — an estimated 700–900 million square metres — than most countries build in a decade. That construction boom, alongside a wave of demolition of ageing and unsafe structures, is generating a mountain of rubble that the country is barely equipped to handle. Government estimates of annual construction and demolition (C&D) waste generation range from 150 million to 500 million tonnes, yet India’s registered recycling plants can process only about 6,500 tonnes a day — a fraction, often cited at around 1 percent, of what is generated. The rest is dumped in landfills, low-lying areas, riverbeds and vacant plots, or simply left to litter city edges.
This article pulls together the latest available government, industry and research data on the scale of the problem, why so little gets recycled, how India compares with other major economies, and what the newly notified Environment (Construction and Demolition) Waste Management Rules, 2025 change. It closes with a set of concrete, evidence-based steps that would be needed to move India from a 1 percent recycling rate toward the 70–90 percent rates achieved by the European Union and Japan.
1. The Scale of the Problem
Estimating India’s C&D waste output is itself a challenge, and the range of official figures says a great deal about the state of the sector. The Building Materials and Technology Promotion Council (BMTPC) put the figure at roughly 150 million tonnes a year as far back as 2018. More recently, the Ministry of Housing and Urban Affairs (MoHUA) has cited a much wider range of 150–500 million tonnes annually — a five-fold uncertainty band that reflects the absence of a standardised, nationwide measurement and reporting system. Independent analysts, including the Centre for Science and Environment (CSE), note that unofficial estimates run three to five times higher than the official baseline, since most C&D waste is never weighed, tracked or reported at all.
Whichever end of the range is closer to reality, the mismatch with processing capacity is stark. Using the more conservative 150-million-tonne baseline, India generates roughly 4.1 lakh (410,000+) tonnes of C&D waste every single day. Registered recycling facilities across the country, by contrast, have a combined installed capacity of only about 6,500 tonnes per day — illustrated below.
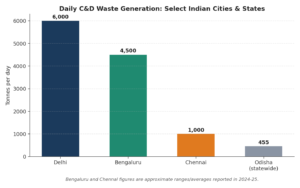
Fig. 1: Even on the more conservative official estimate, daily C&D waste generation outstrips installed recycling capacity by roughly 60 times. Sources: BMTPC; CSE (2023–24); CAG India.
The Centre for Science and Environment’s landmark 2020 study, “Another Brick off the Wall,” found that of the 53 cities required to set up C&D recycling facilities by 2017 under the original 2016 rules, only 13 had done so by 2020. Momentum has since picked up: CSE’s follow-up assessment put the number of operational C&D recycling plants nationally at roughly 27 by December 2023, rising to over 34 by 2024, with another 26–35 plants proposed or under construction. That is real progress — but still nowhere close to matching the scale of what cities generate.
2. What’s Actually in the Rubble
C&D waste is not a single material stream; it is a mixture of concrete, masonry, soil, wood, metal and packaging that varies by building type, age and region. One commonly cited breakdown, drawing on CSE and industry factsheets, estimates the typical composition of Indian C&D waste as follows.
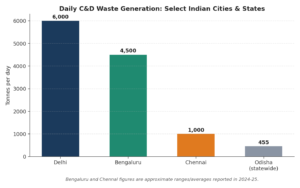
Fig. 2: Indicative composition of C&D waste in India. Actual composition varies significantly by region, building vintage and construction method; some studies report a higher share of soil, sand and gravel relative to finished concrete. Source: CSE / NBM&CW factsheets.
The concrete and masonry fractions matter most for recycling economics: both can be crushed into recycled coarse and fine aggregate that substitutes for virgin stone aggregate and river sand in non-structural and, increasingly, structural concrete. Wood, metal and plastic fractions are comparatively easy to separate and already have functioning scrap markets; the harder problem is the mixed concrete-and-masonry rubble that dominates the waste stream and requires dedicated crushing and screening infrastructure to recover value from.
3. Why the Numbers Keep Climbing
Three structural trends are driving C&D waste generation upward. First, new construction: India is adding an estimated 700–900 million square metres of built-up floor space annually, according to a joint December 2024 assessment by the Council on Energy, Environment and Water (CEEW), WRI India and RMI prepared for the G20 process. Second, infrastructure expansion: India’s national highway network grew by more than 60 percent between 2014 and 2023, generating large volumes of excavated material, old pavement and demolished structures along corridors. Third, redevelopment and demolition: ageing housing stock, unsafe buildings flagged after structural audits, and slum and colony redevelopment schemes in cities such as Delhi, Mumbai and Chennai are demolishing structures faster than replacement recycling capacity is coming online.
Put together, these trends mean the C&D waste problem is not a one-time backlog to be cleared, but a continuously growing flow that will keep outpacing capacity unless recycling infrastructure scales in step with construction activity.
4. City Snapshots: Where the Pressure Is Highest
National totals mask very different realities on the ground. A handful of large cities account for a disproportionate share of both the waste and the (still limited) recycling response.
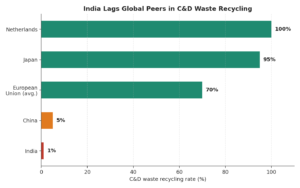
Fig. 3: Estimated daily C&D waste generation in select cities/states. Sources: Municipal Corporation of Delhi / CFlo case studies; Deccan Herald (Bengaluru); Greater Chennai Corporation (Jan–Jul 2025); Odisha State Pollution Control Board (2022–23).
| City / State | Est. daily generation | Recycling response |
|---|---|---|
| Delhi | ~6,000 TPD | Three plants at Burari (2,000 TPD), Shastri Park and Mundka give a combined ~2,650 TPD; a new Tehkhand facility (1,000 TPD, under development) is intended to push total capacity toward the city’s full generation over time. |
| Bengaluru | 4,000–5,000 TPD | Multiple decentralised C&D processing units have been approved by the BBMP, but reported capacity still trails generation. |
| Chennai | ~1,000 TPD (collected, Jan–Jul 2025) | Greater Chennai Corporation has scaled up collection drives; dedicated processing capacity remains limited relative to volumes collected. |
| Odisha (statewide) | ~455 TPD (2022–23) | Waste is largely used for low-lying land filling or sent to solid-waste dumpsites, with minimal formal resource recovery. |
Table 1: City/state-level snapshots compiled from municipal and state pollution control board sources. Figures are approximate and drawn from the most recent publicly reported data as of 2024–25.
Delhi’s experience is instructive. Its Burari plant, commissioned to process the city’s backlog of construction rubble, became India’s largest C&D recycling facility at 2,000 tonnes per day and has been held up nationally as a model. Yet even Delhi — the most advanced case in the country — was, until recently, processing under half of its own daily waste generation, with the balance still finding its way to informal dump sites, riverbanks and vacant land on the city’s periphery.
5. The Cost of Inaction
Environmental costs
Unrecycled C&D waste imposes costs well beyond an eyesore. Debris dumped in low-lying areas and wetlands chokes natural drainage and worsens urban flooding; illegal dumping along riverbanks and in water bodies degrades aquatic ecosystems; and dust from crushed and scattered debris is a measurable contributor to particulate air pollution in Indian cities. At the same time, India’s construction sector continues to draw heavily on virgin river sand and crushed stone aggregate for new concrete — even though every tonne of recycled concrete aggregate that substitutes for virgin material is a tonne of riverbed or quarry left undisturbed. Both central and state governments have tightened restrictions on river-sand mining in recent years precisely because of the ecological damage from unchecked extraction, which strengthens the case for recycled aggregate as a substitute rather than a nice-to-have.
Economic costs — and opportunity
There is also a foregone economic opportunity. A December 2024 discussion paper by CEEW, WRI India and RMI modelled the circular-economy potential across seven Indian waste streams — including construction, along with plastics, organics, batteries, e-waste, end-of-life vehicles and used cooking oil — and estimated a combined annual market opportunity of roughly INR 11.5 trillion by 2047, alongside 8.4 million full-time-equivalent jobs and INR 10.8 trillion in cumulative investment potential across all seven streams. Construction materials recycling is one significant contributor within that basket, though the report does not isolate a stand-alone rupee figure for C&D waste alone — a reminder that the sector still lacks the kind of dedicated market-sizing that plastics or e-waste recycling now attract in India.
What is measurable today is the missed substitution value: Indian Standard IS 383:2016 already permits up to 20 percent recycled concrete aggregate in reinforced concrete of grade M25 and below, meaning there is a ready-made technical pathway for recycled material to displace a meaningful share of virgin aggregate demand in ordinary building construction — a pathway that remains almost entirely unused outside a handful of cities.
6. How India Stacks Up Globally
The gap between India and the world’s more advanced C&D recycling economies is wide even by the standards of environmental infrastructure. The Netherlands recycles close to 100 percent of its C&D waste; Japan, through decades of investment in aggregate-crushing and rebar-recovery technology, recovers roughly 95 percent; and the European Union as a whole averages around 70 percent, with several member states exceeding 90 percent. China, despite its own construction boom, still recycles only around 5 percent nationally (and as little as 3 percent in Beijing specifically), with 70–80 percent of its C&D waste going to landfill — making India’s roughly 1 percent recovery rate an outlier even among large, rapidly urbanising economies.
Fig. 4: Reported national/regional C&D waste recycling rates. Sources: European Commission (EU averages, latest available data); industry and academic literature on Japan and China; CSE/CAG India (India). Rates are drawn from differing years and methodologies and should be read as indicative orders of magnitude rather than a strictly like-for-like comparison.
The comparison is not simply about wealth. China’s experience shows that a large, fast-growing construction sector can still recycle at very low rates without deliberate policy intervention and enforcement — exactly the trap India needs to avoid. The Netherlands and Japan, by contrast, demonstrate that near-total recovery is achievable once landfilling is restricted, segregation is mandated at source, and recycled aggregate is written into public procurement specifications.
7. From the 2016 Rules to the 2025 Overhaul
India’s first dedicated C&D waste regulation, the Construction and Demolition Waste Management Rules, 2016, required generators to segregate waste, made 53 large cities responsible for setting up processing facilities, and set broad recovery expectations. In practice, implementation lagged badly: as noted above, fewer than a quarter of the mandated cities had operational facilities within the original timeframe, and the rules contained no binding, enforceable target for producers themselves to recycle or reuse a defined share of the waste they generated.
On 4 April 2025, the government notified the Environment (Construction and Demolition) Waste Management Rules, 2025, which supersede the 2016 framework and take effect from 1 April 2026. The central change is the introduction, for the first time, of Extended Producer Responsibility (EPR) for C&D waste — modelled on the EPR regimes already used for plastics and e-waste. Under the new rules, “producers” (generally waste generators registered on CPCB portals for building or building-complex projects of 20,000 square metres and above) must meet binding, time-bound recycling and material-utilisation targets, with the option to meet obligations by purchasing EPR certificates from registered recyclers, and a central online portal to register and monitor producers, storage facilities, recyclers and collection points.
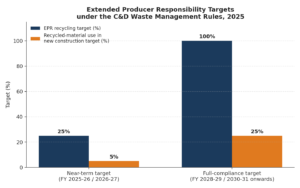
Fig. 5: EPR targets under the Environment (Construction and Demolition) Waste Management Rules, 2025. Source: Ministry of Environment, Forest and Climate Change notification, 4 April 2025.
| Target type | FY 2025-26 / 2026-27 | FY 2028-29 / 2030-31 onward |
|---|---|---|
| Recycling of C&D waste (producer EPR target) | 25% | 100% |
| Use of processed/recycled material in new construction | 5% (from 2026-27) | 25% (from 2030-31 onward) |
Table 2: Phased EPR targets under the 2025 Rules. Producers can meet targets directly or via purchase of EPR certificates from CPCB-registered recyclers.
The 2025 Rules address a real gap: the 2016 framework put the onus on municipalities to build capacity but placed no enforceable obligation on the generators of waste — developers, contractors and demolition agencies — to use that capacity once built. By tying compliance to specific projects and creating a certificate market, the new rules attempt to generate a bankable demand signal for recyclers, similar to the way renewable-energy or plastic-waste certificate markets have helped scale those sectors. Whether this succeeds will depend heavily on enforcement capacity at the state pollution control board level, and on whether the 20,000-square-metre threshold captures enough of the market — a large share of India’s C&D waste is estimated to come from smaller, individual house-building and renovation projects that fall below that threshold and are far harder to regulate.
8. Why So Little Gets Recycled Today
Several structural barriers explain the gap between policy intent and outcomes on the ground.
- Little to no source segregation: most demolition, especially of smaller structures, is carried out by unorganised local contractors who mix concrete, masonry, wood, metal and soil together, making downstream sorting costly and often uneconomical.
- Weak enforcement of the 2016 rules: penalties for illegal dumping have historically been low relative to the cost of legal disposal, so dumping on vacant land or in low-lying areas remained cheaper than trucking waste to a registered facility.
- Limited, uneven processing capacity: with only ~27–34 operational plants nationally as of 2023–24 concentrated in a handful of metros, most tier-2 and tier-3 cities have no formal processing option at all.
- Weak demand for recycled output: government departments — the largest single buyers of construction material in India — have been slow to specify recycled aggregate in tenders, even though IS 383:2016 permits its use, leaving recyclers without assured offtake for their processed material.
- Fragmented data systems: the five-fold range in official generation estimates (150–500 million tonnes) makes it difficult for planners to size the recycling capacity actually needed city by city.
- Informal collection economics: scrap dealers already profitably recover metal, and to a lesser extent wood, from demolition sites, but the bulkier, lower-value concrete and masonry fraction — roughly two-thirds to three-quarters of the waste stream — has no comparable informal market pulling it out of landfills.
9. What Effective Recycling Would Require
Closing the gap between India’s ~1 percent recycling rate and the 70–90 percent rates achieved elsewhere will require action on several fronts simultaneously, not any single fix.
- Mandatory source segregation and waste-tracking, extended down to medium-sized projects rather than only the 20,000-square-metre-plus developments covered by the 2025 EPR rules, since a large share of aggregate volume comes from smaller sites collectively.
- Faster build-out of decentralised, small-footprint crushing and screening units in tier-2 and tier-3 cities, rather than relying only on large centralised plants of the kind Delhi has built, to keep haulage distances — and therefore illegal dumping incentives — low.
- Mandatory use of recycled aggregate in public procurement, particularly for road sub-base, pavement, and non-structural concrete in government buildings, which would create the assured demand recyclers currently lack; several countries with high recycling rates built their markets this way.
- A functioning EPR certificate market, with credible monitoring by CPCB and state boards, so that the 2025 Rules’ targets translate into real payments to recyclers rather than becoming a paperwork exercise, as happened with some early plastic-waste EPR compliance.
- A standardised, transparent measurement and reporting system for C&D waste generation, to close the 150–500-million-tonne estimation gap and let cities size recycling capacity against actual, verified need.
- Formalising and supporting the informal demolition and scrap sector, which already handles a meaningful share of metal and wood recovery, so it can be integrated into the concrete-and-masonry recycling chain rather than working around it.
Conclusion
India’s construction sector is one of the largest and fastest-growing in the world, and that scale is exactly why its waste problem cannot be solved with the current patchwork of a few dozen big-city plants. The Environment (Construction and Demolition) Waste Management Rules, 2025 mark a genuine shift — for the first time putting a binding, phased recycling obligation on the producers of C&D waste rather than only on municipalities — but rules on paper have not historically translated into recycling capacity on the ground in this sector. Whether India moves meaningfully off its roughly 1 percent recycling rate over the next five years will depend on enforcement, on whether smaller projects are eventually brought into the regulatory net, and above all on whether government procurement itself starts buying the recycled aggregate the country is trying to produce.
Sources
Centre for Science and Environment (CSE), “Another Brick off the Wall: Improving Construction and Demolition Waste Management in Indian Cities,” and subsequent CSE analyses on C&D waste recycling rates and operational plant counts (cseindia.org).
Down To Earth, reporting on CSE findings regarding India’s C&D waste recycling rate (downtoearth.org.in).
Citizen consumer and civic Action Group (CAG), “India’s construction boom and the waste challenge: Policies, gaps, and data” (cag.org.in).
Council on Energy, Environment and Water (CEEW), WRI India and RMI, “Unlocking India’s Circular Economy Potential,” December 2024, and CEEW analysis “How can India Scale Construction & Demolition Waste Recycling?” and “Can C&D Waste Rules 2025 Clean Up India’s Construction Waste?” (ceew.in).
Ministry of Environment, Forest and Climate Change, Government of India, Environment (Construction and Demolition) Waste Management Rules, 2025 (notified 4 April 2025; effective 1 April 2026); and the earlier Construction and Demolition Waste Management Rules, 2016.
Building Materials and Technology Promotion Council (BMTPC), C&D Waste Ready Reckoner and national generation estimates (bmtpc.org).
Bereau of Indian Standards, IS 383:2016 — Coarse and Fine Aggregate for Concrete: Specification, permitting recycled concrete aggregate use up to 20% in RCC of grade M25 and below.
Municipal Corporation of Delhi / CFlo case study on the Burari, Shastri Park and Mundka C&D recycling plants; Tribune India reporting on plant inaugurations (cfloworld.com; tribuneindia.com).
Deccan Herald, reporting on Bengaluru’s C&D waste generation and processing plants (deccanherald.com).
Greater Chennai Corporation collection data, January–July 2025, as reported in national press coverage of Chennai’s C&D waste drive.
Odisha State Pollution Control Board data on statewide C&D waste generation, 2022–23.
Scroll.in and Mongabay India, reporting on the Environment (Construction and Demolition) Waste Management Rules, 2025 and its EPR framework (scroll.in; india.mongabay.com).
Comparative recycling-rate figures for the Netherlands, Japan, the European Union and China drawn from published academic and industry literature on global C&D waste management, including European Commission data summaries and peer-reviewed studies on Chinese construction-waste recovery rates.
Note on data quality: Because India lacks a single, standardised national C&D waste tracking system, figures cited across sources vary — sometimes substantially — depending on methodology, year and geographic scope. Where sources conflicted, this article reports the range and flags it explicitly rather than presenting a single number as definitive.