


Almost every person alive, doing nothing but making tea. One mug each, every second, day and night. Every single one poured into the sea.
That is the scale of heat the world’s oceans absorbed in 2025.
The image comes from Jan Zalasiewicz of the University of Leicester, Colin Summerhayes of the Scott Polar Research Institute at Cambridge, and Martin Head of Brock University, writing in The Conversation in July. They were trying to solve a problem that has defeated climate communicators for thirty years: the numbers involved are literally unimaginable.
The measurement problem
The ocean absorbs roughly 90% of the extra heat now being trapped at the Earth’s surface. This is the single most under-appreciated fact in climate science. We experience warming as hot air and broken temperature records, but the atmosphere is, in the authors’ phrase, a sideshow — we notice it only because we happen to live in it.

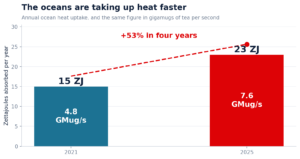
The problem is what happens when you try to state the quantity. In 2021, an analysis led by the Chinese climate scientist Lijing Cheng put the ocean’s annual heat uptake at 15 zettajoules.
A zettajoule is a one followed by twenty-one zeros. It is not a number the human mind can hold. The standard workaround has been the Hiroshima comparison — around seven atomic bombs per second — which is vivid but sits comfortably outside anyone’s actual experience.
So the three scientists reached for something duller and far more effective. Heating a mug of tea takes about 100,000 joules. Divide 15 zettajoules by that, then by the number of seconds in a year, and you get 4.8 billion mugs of hot tea entering the ocean every second.
They went further and proposed a formal unit. Following the scientific convention of “giga” for billion: gigamugs per second, or GMug/s.
What the new unit shows
Here is why the unit matters more than it first appears. Applied to the updated data, it makes an acceleration visible that a zettajoule figure obscures.
An updated analysis puts 2025 ocean heat uptake at roughly 23 zettajoules — about half as much again as four years earlier. In the new unit, the oceans went from 4.8 GMug/s to 7.6 GMug/s.
That is very close to one mug of tea per second, for every person on Earth.
The authors are careful, and so should anyone quoting them be: the precise figure is subject to natural variability and measurement uncertainty. This is one year against another, not a smooth trend line. But the direction is not in dispute, and the mechanism behind it is understood.
The comparison that should stop you
Now put the number next to the one measure of energy we do intuitively understand — our own.
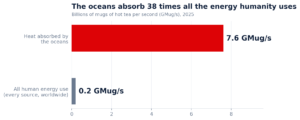
Every joule of energy expended for human use worldwide, from every source — all electricity, all transport, all industry, all heating and cooling, everywhere, for a whole year — comes to a bit more than half a zettajoule. In the new unit, about 0.2 GMug/s.
The oceans are absorbing roughly 38 times the energy the entire human species consumes.
The authors add a detail that lands harder than any of the aggregate figures. Make a single mug of tea using fossil-fuelled energy, and the carbon dioxide released means you have also, in effect, poured a dozen or more mugs of hot tea into the sea.
Why it is speeding up
Three mechanisms, and the third is the one that should concern investors most.
Greenhouse gas concentrations continue to rise — the straightforward driver. Second, the air is getting cleaner: reductions in sulphate aerosol pollution, a genuine public health success, have removed some of the haze that was reflecting sunlight back to space. Cleaner air lets more energy in.
The third is a positive feedback, and it is not fully settled science. There is evidence that warming is beginning to reduce reflective cloud cover, allowing still more heat to be absorbed — warming causing changes that cause more warming. If that mechanism is confirmed and significant, the implications for every climate projection currently underpinning transition planning are serious.
Why this belongs in an ESG publication
It would be easy to file this as climate science and move on. That would be a mistake, for three reasons.
Ocean heat is committed warming. Unlike atmospheric temperature, which responds relatively quickly to changes in emissions, heat absorbed into the deep ocean stays there for centuries. It is already raising sea levels through thermal expansion, driving marine heatwaves and melting polar ice. Nothing announced at any future COP reverses the 23 zettajoules absorbed last year. For anyone modelling physical climate risk on a corporate balance sheet, this is the floor, not the forecast.
The physical risk channel is direct. Marine heatwaves affect fisheries, aquaculture and coastal tourism revenues. Thermal expansion drives sea level rise, which drives coastal asset impairment and insurance repricing. Warmer seas intensify tropical storms, which drive supply chain interruption. These are not abstract externalities; they appear in insurance loss ratios and in port operations.
And the timing is uncomfortable. As we reported in our last issue, four major jurisdictions eased corporate sustainability disclosure requirements within weeks of one another — California delaying SB 253, the UK’s FCA proposing to drop TCFD for investment products, Brazil withdrawing mandatory ISSB reporting, the EU simplifying Taxonomy disclosures.
The physical signal is accelerating at precisely the moment the reporting signal is being turned down.
The honest caveats
Three, and they matter if you are going to quote these numbers.
The mug figure is an analogy, not a measurement. It is arithmetic performed on a scientific estimate to make it communicable. The underlying science is the ocean heat content data; the tea is presentation.
The year-on-year jump is not a trend. 2021 to 2025 is two data points, and ocean heat content varies naturally, notably with ENSO cycles. The longer record supports acceleration; these two figures alone do not prove it.
And cloud feedback remains an active research question. The authors say “perhaps partly” for good reason. Treat it as a plausible amplifier under investigation, not an established parameter.
The bottom line
The value of what these three scientists have done is not scientific. It is communicative, and communication has been the binding constraint on climate action for a generation.
A zettajoule means nothing to a board. Seven Hiroshima bombs a second means something, but it is so far outside experience that it slides off. A mug of tea is the most ordinary object in the world — and once you know that the ocean takes on 7.6 billion of them every second, and that this is thirty-eight times everything humanity does with energy, the number stops being abstract.
Whether that changes any decisions is a separate question. But it removes the excuse that nobody could picture the problem.
Reported by ESG World News from “‘7.6 billion mugs of tea a second’: a new way to make sense of the heat pouring into our oceans” by Jan Zalasiewicz (University of Leicester), Colin Summerhayes (Scott Polar Research Institute, University of Cambridge) and Martin J. Head (Brock University), published in The Conversation, 16 July 2026 under a Creative Commons licence. Underlying ocean heat content data from Cheng et al., Advances in Atmospheric Sciences. Charts prepared by ESG World News from the figures cited.
Note on the figures: the mugs-per-second and GMug/s values are the authors’ own arithmetic applied to published ocean heat content estimates. The 38× comparison to human energy consumption is calculated from the authors’ stated figures of 7.6 GMug/s and approximately 0.2 GMug/s. Annual ocean heat uptake is subject to natural variability and measurement uncertainty; two years do not constitute a trend.